Gridledger: one data layer for every renewable asset
A product thesis for an open data layer across renewable energy assets, argued as a position rather than shipped as a platform.
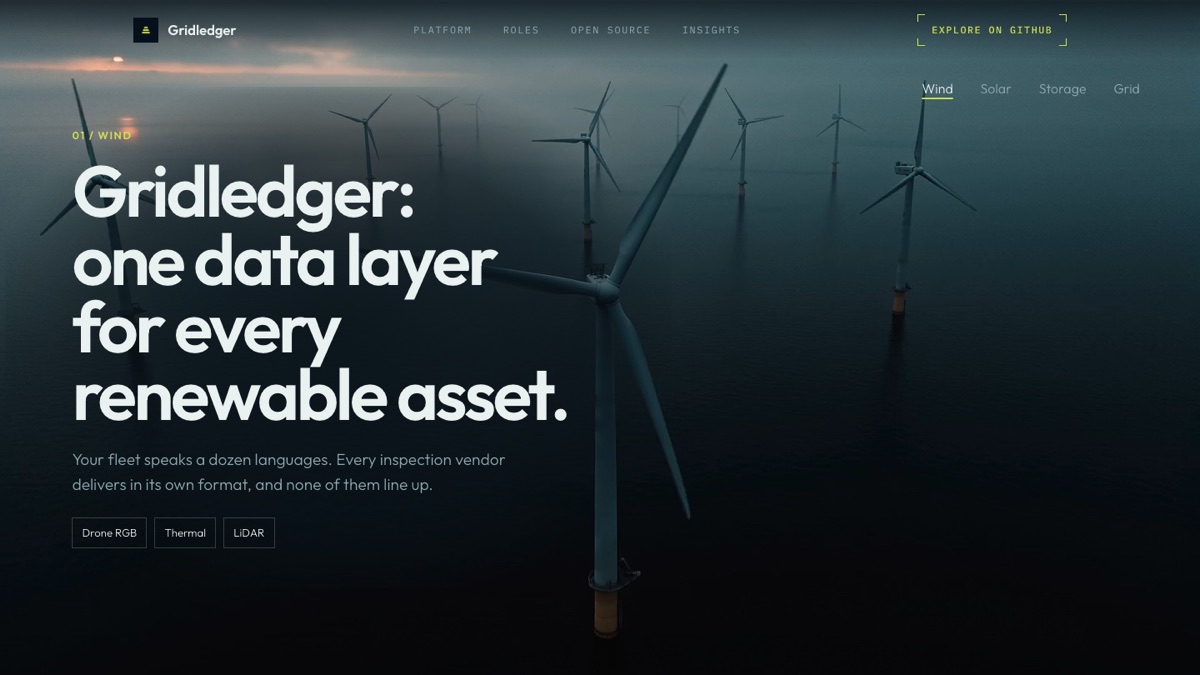
Gridledger is the clearest way I have found to state a problem I kept running into across three employers in renewable energy: the data exists, the analysis exists, and neither one travels. It is a thesis, not a product. What I built is the argument, the asset model it rests on, and a site that makes the case well enough to be disagreed with.
The problem I kept meeting
Every renewable asset gets inspected and monitored, and every vendor delivers in a shape of its own. Blade inspections arrive as PDFs, thermal maps, and a portal login. Aerial thermography lands in one system while the SCADA export lands in another and the summary report lands in an inbox. Battery health shows up as a vendor dashboard that cannot be compared against the vendor dashboard next to it.
The result is not missing data. It is data that cannot be added up. A fleet can hold thousands of findings and still not answer which asset is in the worst condition, because the findings were never expressed in terms that let them be ranked against each other. Degradation you cannot compare is degradation you cannot see.
I saw the same shape of problem at three different renewable energy companies, in different roles and against different asset classes, which is what convinced me it was structural rather than local. Nobody involved was doing anything wrong. Each vendor had a good reason for its own format, and there was no shared model for any of them to target.
The thesis
One open asset model, and open adapters that normalize any vendor's output into it. Every record maps to a physical component, severity scales are aligned on the way in, and each asset keeps an append-only condition history that any tool can read. The claim is not that this is technically hard. It is that the model has to be open for anyone to trust it, because a normalization layer owned by one vendor is just a new lock-in with better ergonomics.
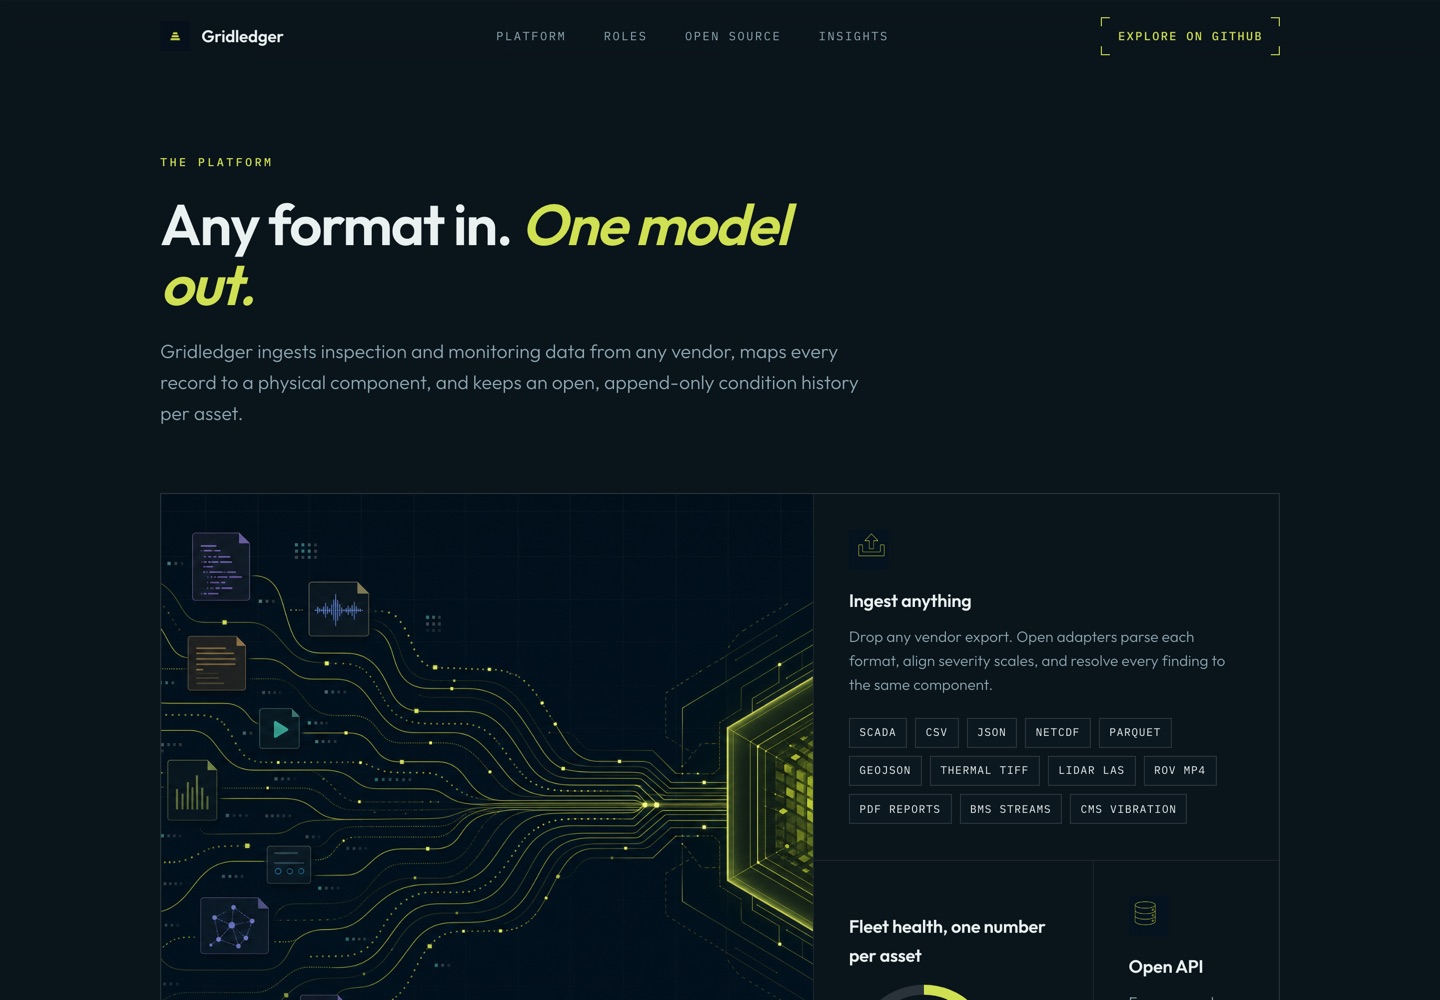
Any format in, one model out
The ingest argument is the load-bearing one, so the site names the formats instead of gesturing at them: SCADA, CSV, JSON, NetCDF, Parquet, GeoJSON, thermal TIFF, LiDAR LAS, ROV MP4, PDF reports, BMS streams, and CMS vibration. Each gets its own adapter. Adapters parse the source format, resolve every finding to a component in the asset tree, and align the vendor's severity scale to the shared one.
Naming the formats is a deliberate constraint on myself. A vague claim about supporting any vendor is unfalsifiable; a list is something a practitioner can look at and tell me I am wrong about.
Eight roles reading one record
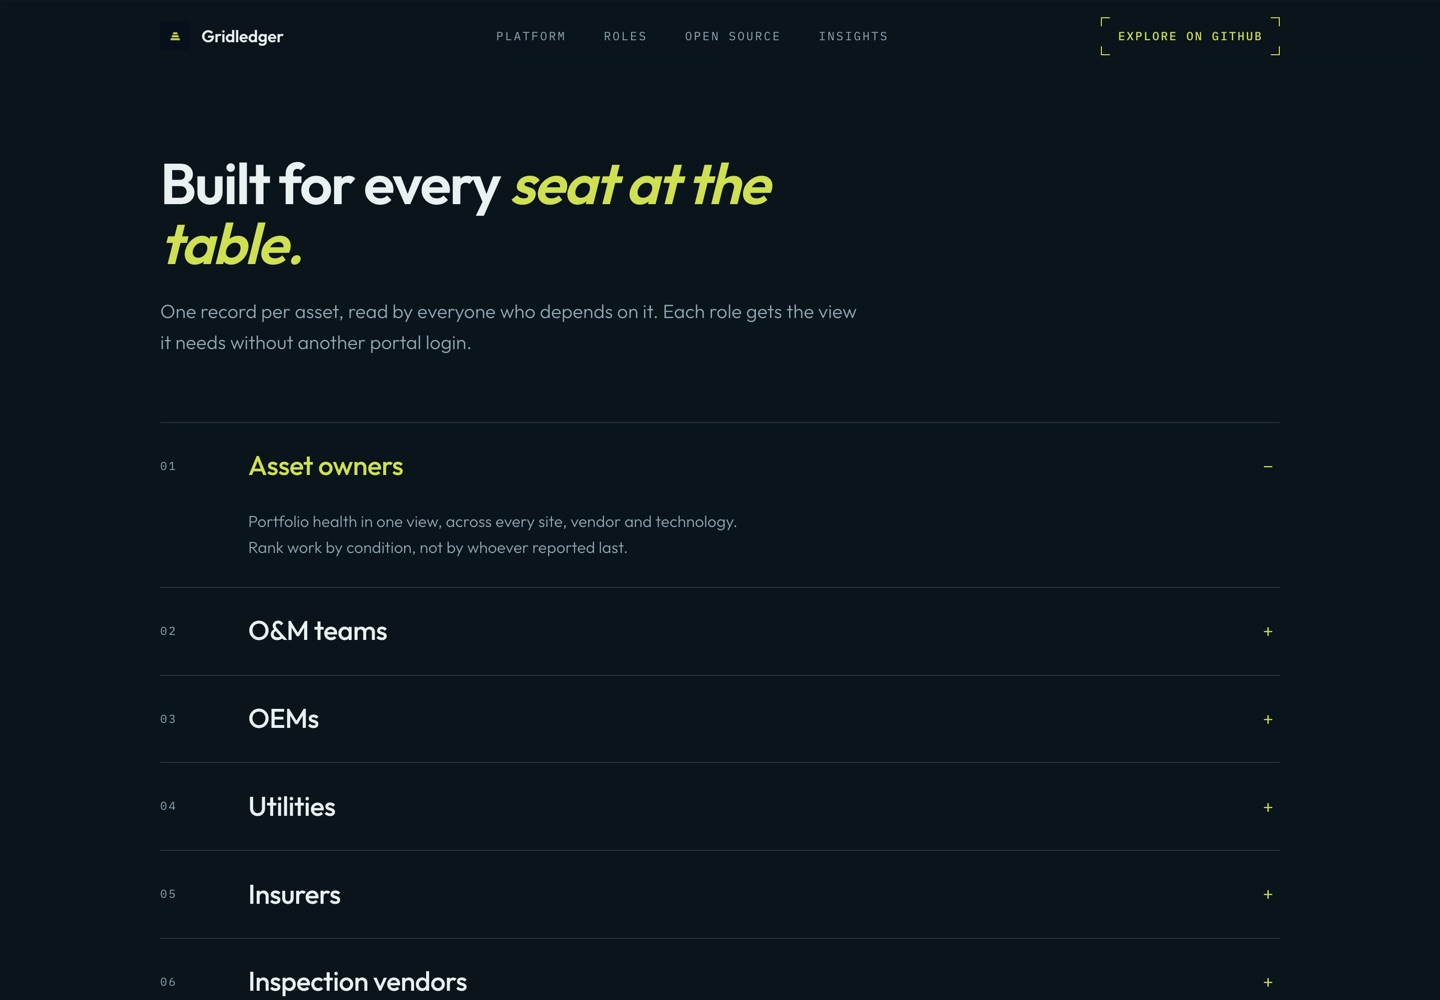
The second half of the thesis is that normalization is only worth doing if more than one party reads the result. Gridledger defines eight stakeholder roles and what each one needs from the same underlying record: asset owners ranking portfolio work by condition rather than by whoever reported last, O&M teams dispatching against severity across the whole fleet, OEMs seeing failure patterns across every operator running their machines, utilities exporting a compliance trail from finding to closed work order, insurers reading a verifiable condition history straight from source data, inspection vendors delivering once into the client's system of record, repair vendors scoping from shared findings and closing the loop with structured repair records, and landowners getting a window into the assets operating on their land.
Writing all eight was the part that changed my own mind. Two of them, insurers and landowners, only became obvious once I had the model written down and asked who else would read it. That is the test I would apply to the model generally: if a role can be served without a new portal login, the record is doing its job.
What I cut
- Pricing and the business model. Left out entirely. The open question for an open data layer is adoption, not monetization: it either becomes the thing vendors target or it does not, and no pricing page answers that. Putting numbers on it would have made the thesis look more finished while saying less.
- Hydro, tidal, and wave. The asset class list started wider and came down to six: wind, solar, storage, transmission, geothermal, and distribution. Hydro carries a dam safety and regulatory regime that the model was not built for. Tidal and wave came off because I could not describe their inspection realities specifically enough to defend the claim, and a class I cannot describe is a class that weakens the list it sits in.
- A working ingest demo. There is no adapter you can run. Building one before the model is agreed would have argued the easy half of the point and let me skip the hard half.
What is true today, and what is not
Gridledger is designed to be open source under the MIT license, with open adapters and an open API. Those are the design commitments of the thesis, not shipped facts. No code is published: github.com/gridledger is an empty organization, and the license, the adapters, and the API exist as a written position rather than a repository.
The concept site originally stated all of that in the present tense, the way a product site would, and pointed four calls to action at that empty organization. I rewrote the copy to say what is actually true and repointed those buttons at the field notes, because a claim nobody can check is worth less than a smaller one that holds. It is the same reason the card on this site reads Concept rather than Live, and why this page claims no user, no deployment, and no integration. What is built is the argument and the site that carries it.
The site measures whether the argument lands
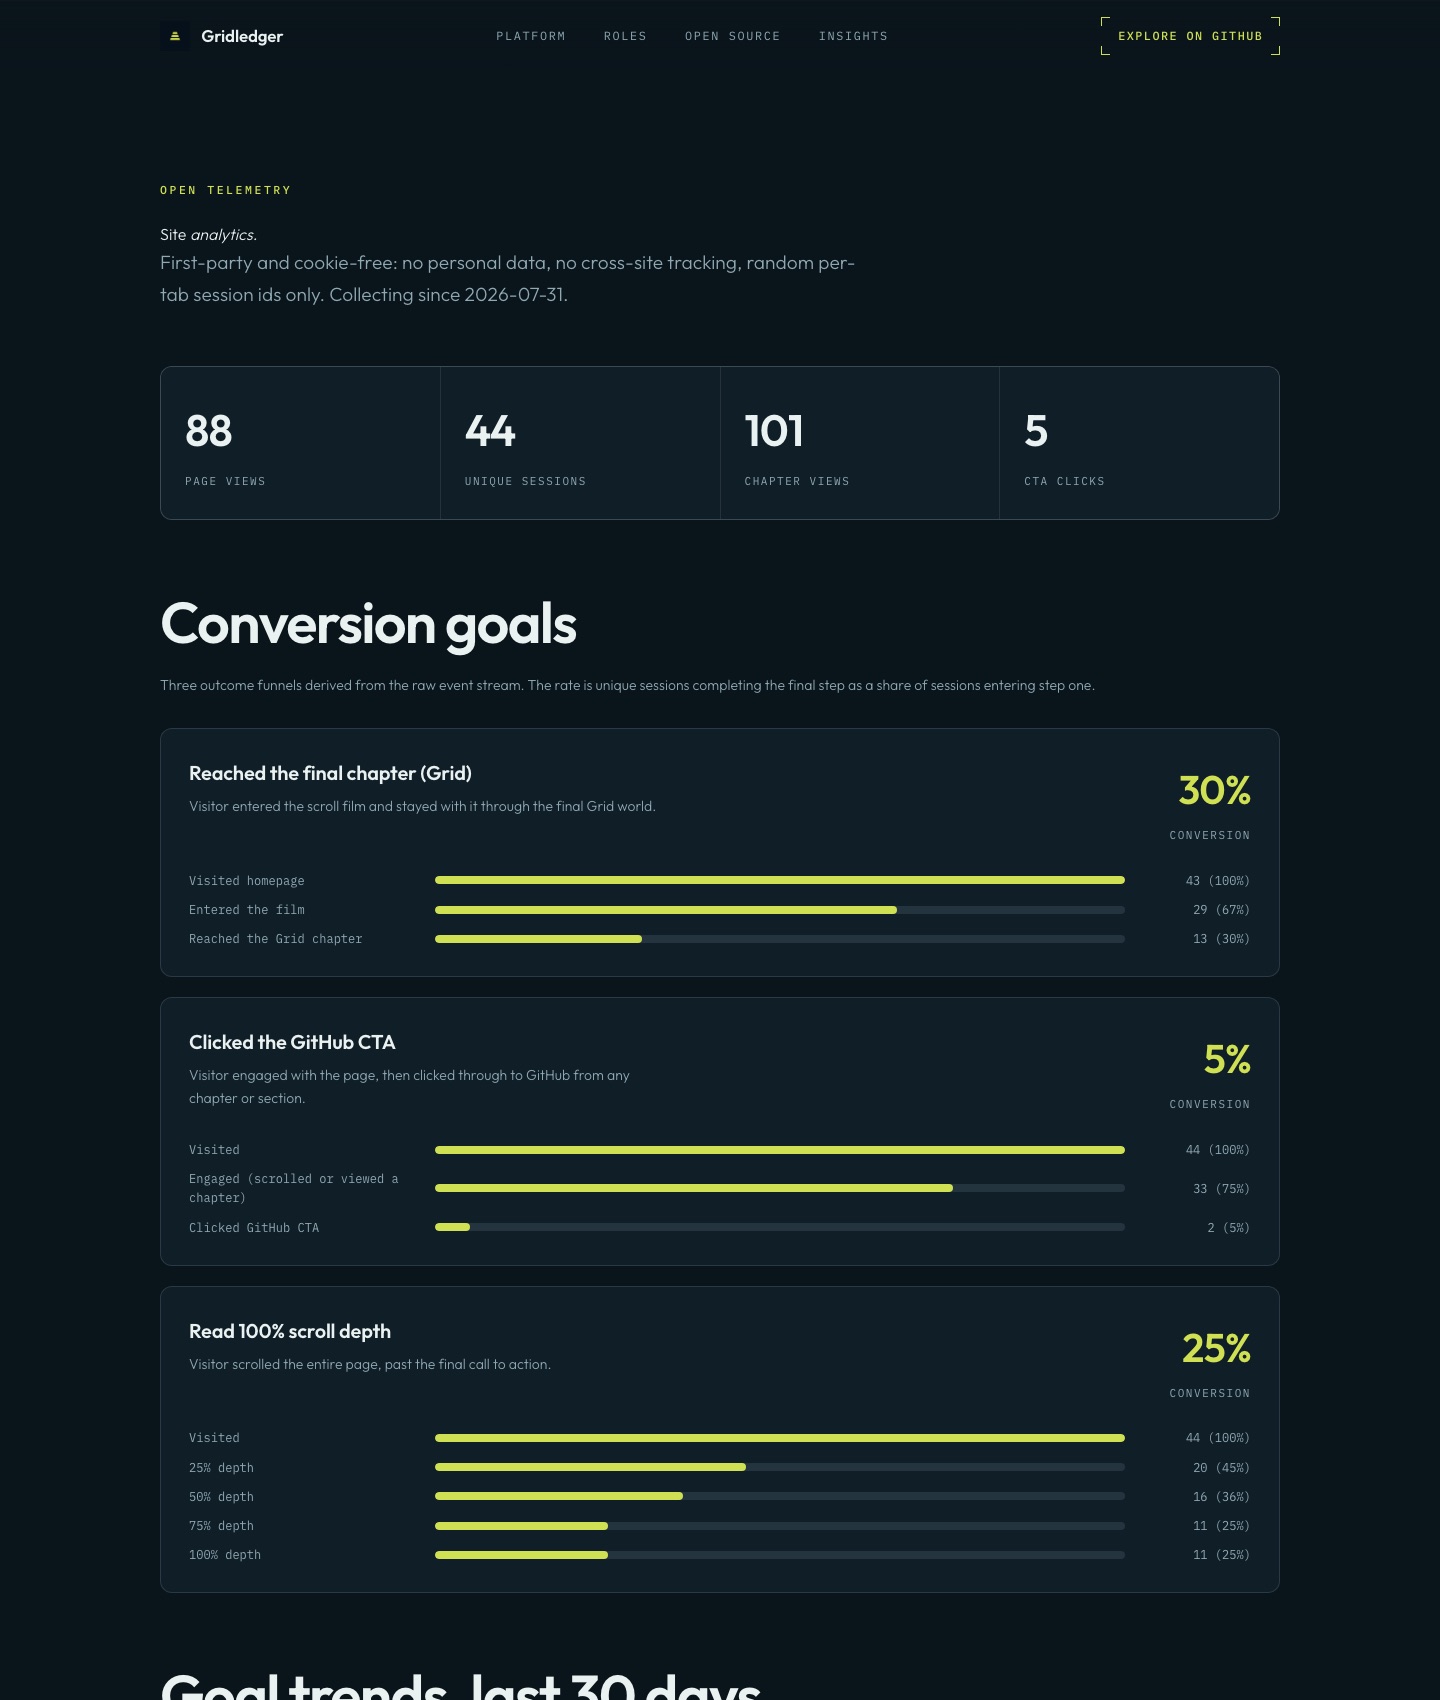
Since a thesis has no usage metrics, I instrumented the only thing there is to measure: whether people read it. Gridledger carries first-party, cookie-free telemetry with no personal data and no cross-site tracking, only a random per-tab session id, and it publishes the results openly at /analytics rather than keeping them in a dashboard I could describe selectively.
Collecting since 31 July 2026, and reading it on 1 September 2026: 88 page views across 44 sessions, 30% of sessions reached the final chapter of the scroll film, and 25% scrolled the whole page. This is small-sample traffic to a concept site, including my own visits, so it is a readership signal and nothing more. It tells me the film holds people to the end more often than not, and that the ratio worth improving is the 67% who enter the film against the 100% who arrive.
What I would build first
The asset model schema, documented, before anything else. One schema covering sites, components, findings, and condition history, written down precisely enough that two people could independently map the same vendor export to it and produce the same records. Nothing else in the thesis is testable until that exists: an adapter has nothing to target, the eight role views have nothing to read, and the open license protects an empty repository.
The hardest honest part of it is severity alignment. Mapping one vendor's five-point blade damage scale onto another's means mapping both onto the damage matrices the industry already uses, and the schema has to make that mapping explicit and auditable rather than burying it in adapter code. I would expect that single question to take longer than the rest of the schema combined, which is a reason to start there rather than a reason to start elsewhere.
Where it stands
- A concept site live on Cloudflare Workers, carrying the full thesis: the problem, the asset model, twelve named source formats, and eight stakeholder roles defined end to end.
- Three field notes written as working notes on inspection formats, BESS degradation data, and the normalization pattern itself.
- First-party cookie-free analytics, published openly rather than held privately, so the readership claim can be checked against the same numbers I read.
- No code published and no user. The MIT license and the open adapters are the thesis's commitments, not shipped facts.