FleetServ: inspection first, invoice last
Environment footage and stills on this page are generated and illustrative. The product reel and screenshots are the real interface.
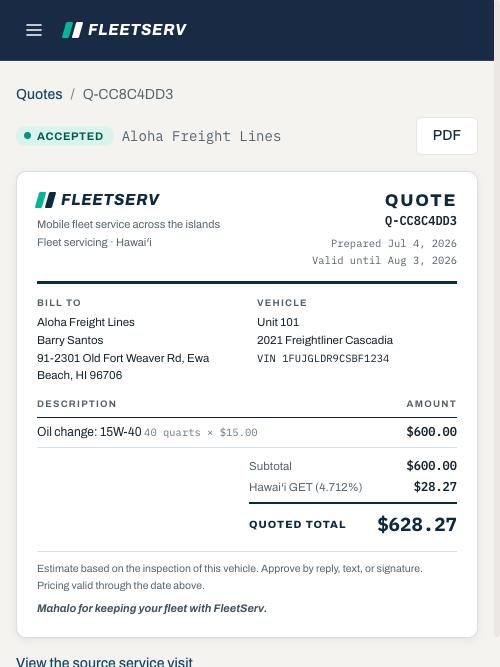
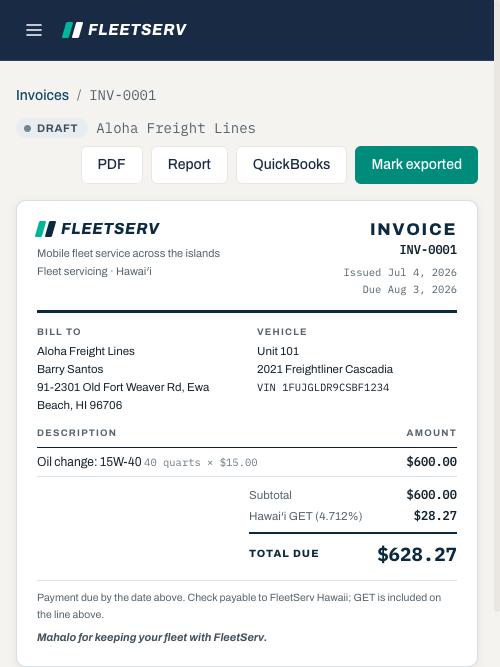
The reel above walks through FleetServ's quoting and invoicing surface in motion, driven by the same design tokens and the same Hawaiʻi GET math the app runs, so every total on screen is the number a customer would see. Nothing is mocked. That surface is real and it works. It is also the back half of the product, and leading with it was the mistake this page corrects.
The user and the problem
A mobile fleet mechanic going out on his own already knows the trade cold. The easy read is that his problem is the back office, and it partly is: quoting, invoicing, job records, and a client-ready PDF, all handled between jobs with no one to hand the admin to.
But that is his problem, not his customer's. A fleet manager does not buy invoicing. What he buys is knowing the condition of his trucks before one of them is sitting on the shoulder of the H-1 with a load on it. The operator's product is the inspection. Everything else is how he gets paid for it.
I scoped FleetServ around that, with the capture happening in the yard on a phone, in the sun, sometimes with gloves on. Designing around how the real workflow runs, rather than how software usually models it, drove most of what follows.

Operational health is the product
Fleet asset operational health through tracked maintenance is the business. That phrase unpacks into something plain: every truck has a condition, the condition changes, and somebody should be writing it down in a way that can be read back later.
An inspection is how the condition gets written down. A finding is what an inspection produces. Quoting, scheduling, and invoicing are what a finding turns into once the customer agrees the work is worth doing. They round out the business, and a one-person shop cannot run without them, but they are downstream. Build them first and you get a billing tool that happens to carry a checklist. Build the inspection first and the billing falls out of it.
One job record, three audiences
Everything in FleetServ hangs off a single job record that changes shape depending on who is looking at it. The technician feeds it from the field. The admin runs the business from it. The customer only ever sees the documents it generates.
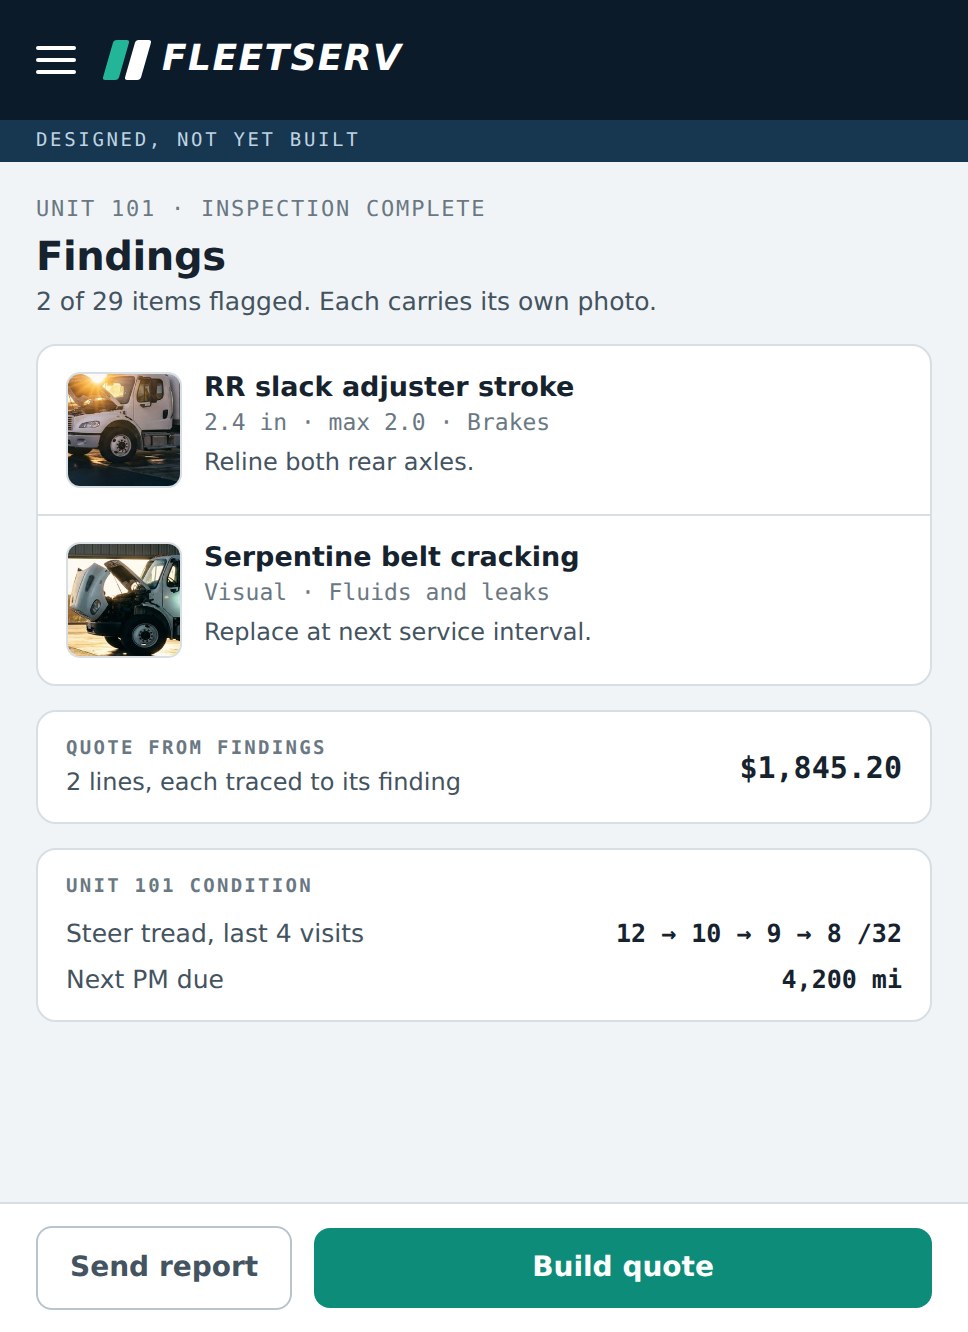
The record should start with a finding and end with a paid invoice, and every line on that invoice should point back at the finding that justified it. That is the product in one sentence, and it is the standard the rest of this page measures against.
What ships today, and where it stops
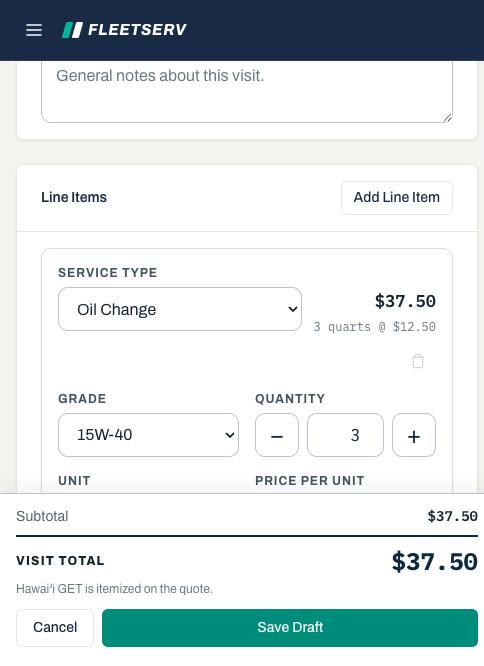
The commercial layer is done. The job and quote pipeline with status tracking; per-visit service logging with fields tailored to each job (oil grade and quantity, fluid and fuel type, fuel gallons, tire PSI and location); a quote builder that recomputes each line as quantities and rates change; customer and vehicle records with service history per truck; and print-ready PDF quotes, invoices, and service reports, with the invoice exported as a QuickBooks import file rather than payment collected in the app.
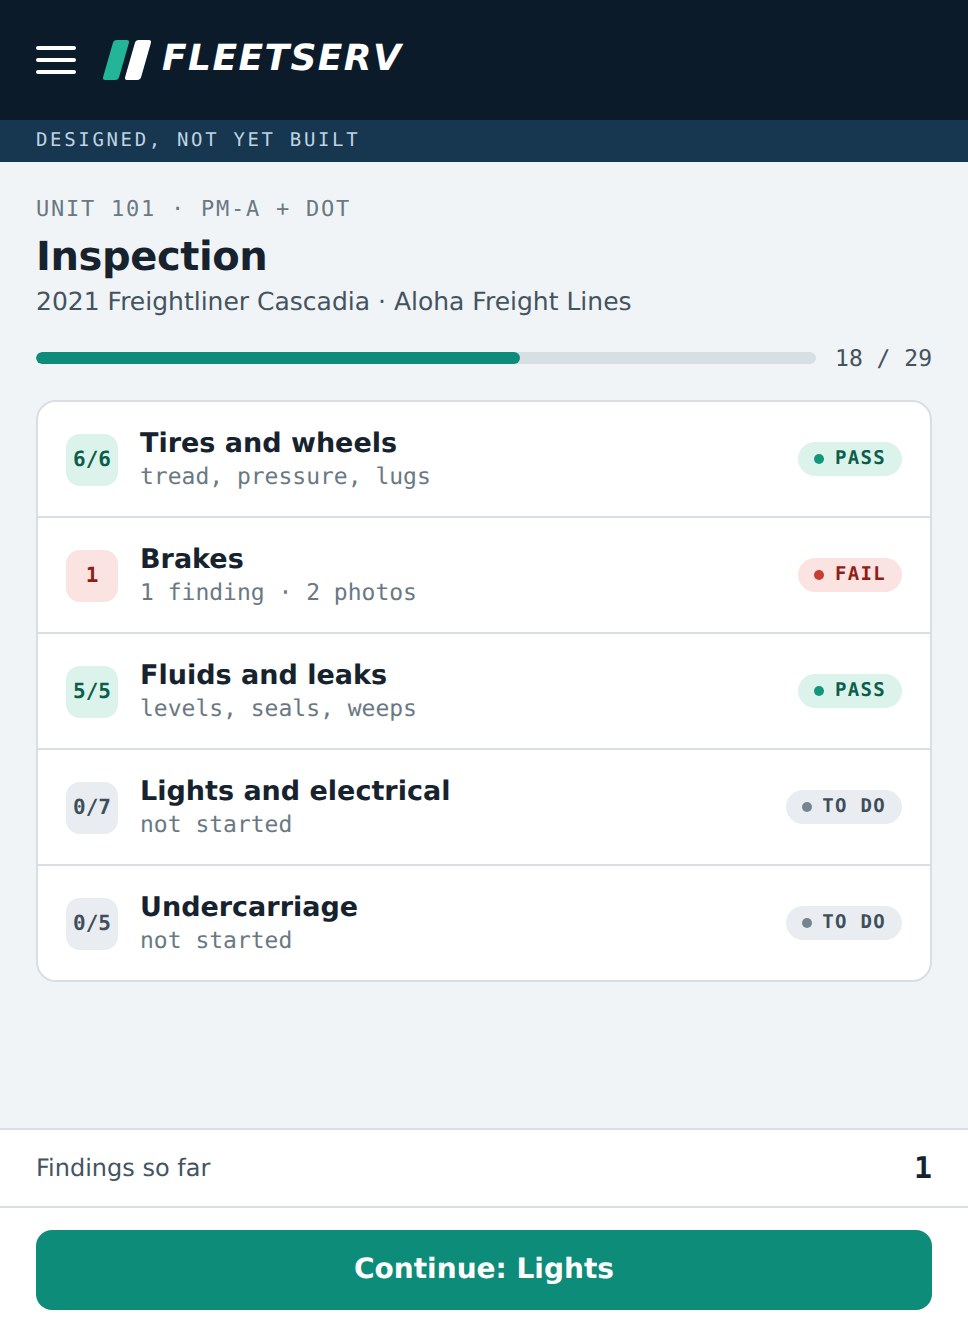
On the inspection side, less. An inspection is a pass or a fail across six fixed categories (lights, brakes, tires and wheels, belts and hoses, fluid leaks, mirrors and glass) plus a free-text note. Photos attach to the visit as a whole rather than to anything in particular.
One place the shipped product already does what the thesis asks: the service report PDF carries the technician's photos through to the customer, captioned, with an explicit empty state when none were taken. A fleet manager who gets one can see the truck the way the technician saw it. What he cannot see is which photo goes with which finding.

The constraint is one text column
Going back to the code to write this page turned up the thing that actually blocks the inspection module, and it is not a missing screen.
Every structured value the operator enters is flattened into a sentence before it reaches the database. The form knows that the brakes failed. The row that lands in the table looks like this:
service_type: "visual_inspection"
description:  "Inspection. Lights: Pass, Brakes: Fail, ..."
quantity:     1
The same happens to oil grade, tire PSI, and tire location. The line-items table has no column for any of them, only service type, description, quantity, unit, unit price, and subtotal. The structure exists in the form and dies at the database boundary.
That one decision explains everything the product cannot do. It cannot say which trucks failed brakes last quarter, because no row says so. It cannot trend tread depth across visits, because no depth was ever stored as a number. It cannot bind a photo to a finding, because a finding is not a row to bind to. It cannot seed a quote from findings, for the same reason.
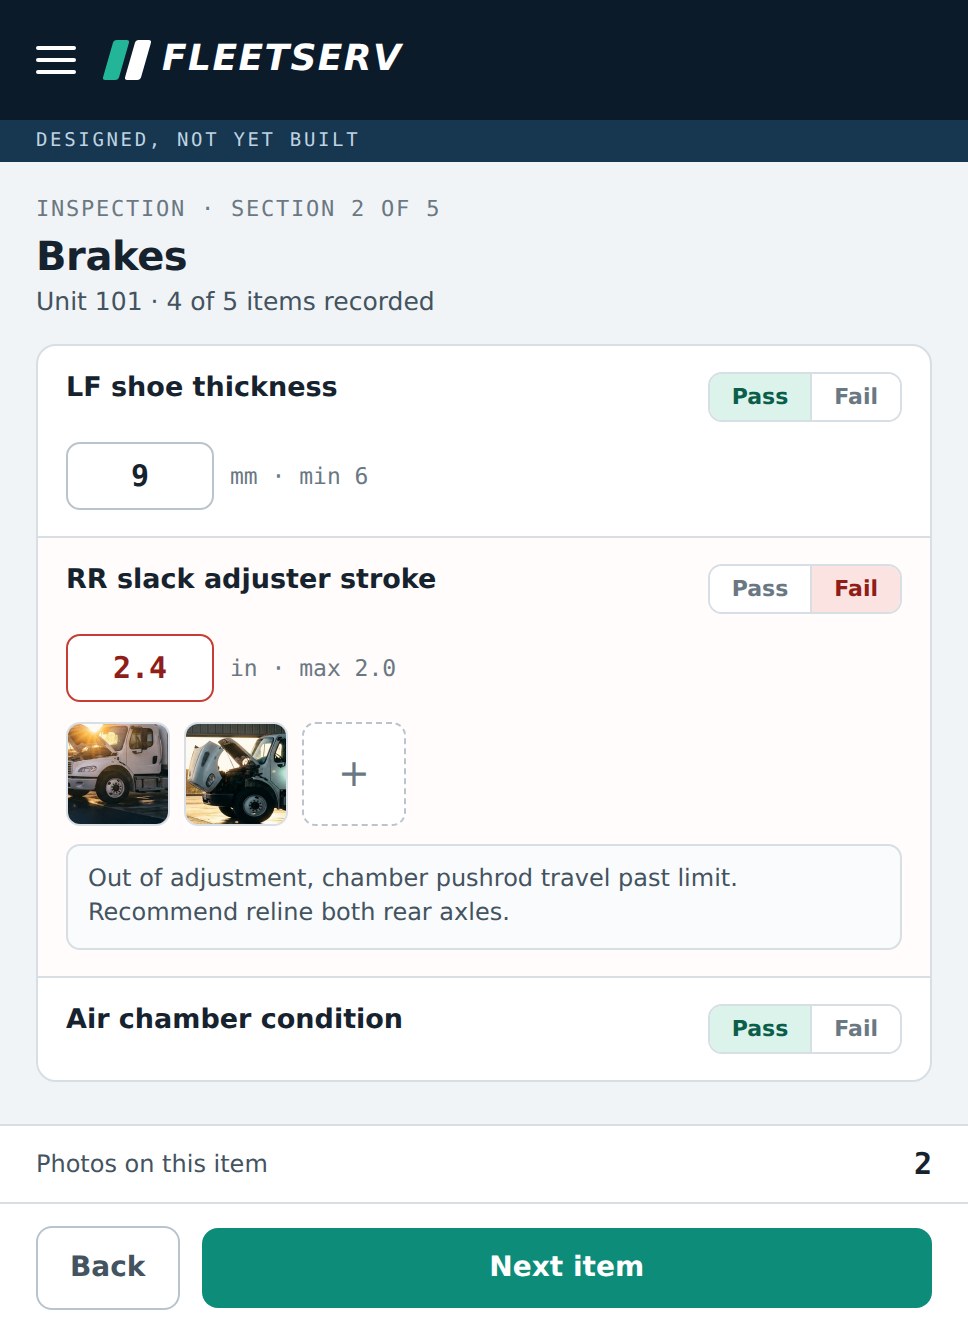
So the next build is not an inspection screen. It is a data model: findings as rows, values with units, photos carrying a foreign key to the finding they document. The screen is the easy half. Naming that correctly is the difference between a roadmap item that takes a week and one that takes a month, and I would rather be right about which.
What I prioritized, and what I cut
- Shipped the busiest path first. Quote, accept, invoice, PDF went live before fleets, service visits, or search. That got a working spine in front of real jobs sooner, and it was the right call for the launch. It was the wrong emphasis for the story, which is what this rewrite fixes.
- One object, two states. A quote converts into an invoice in place, one history per job, so nothing is keyed twice. It cost some data-model flexibility and bought back a solo operator's day of double entry.
- Designed for the field, not the desk. 44px tap targets and a 16px text floor for gloved hands in direct sun, with status shown as a labeled chip rather than color alone so it reads for colorblind users too. I set those numbers and checked the contrast numerically rather than trusting my eye. I checked them against the design system and not against the shipped build, and the gap between those two is its own section.
- Flattened the line item, and would not again. Collapsing every service type into one description string kept the schema small and shipped the pipeline fast. It is also the single decision that put a ceiling on the product, and it is now the first thing on the roadmap to undo.

A judgment call on data I'd stand behind
A customer view wanted lifetime-billed and open-balance totals. The data layer was frozen and couldn't produce them honestly, so I left them out and documented why, rather than show a figure that might be wrong. Less on the screen, but every number on it is one the operator can defend to a customer.
Re-reading the code for this rewrite, that call and the constraint above turn out to be the same call seen twice. Both come from a schema that stores results rather than facts. I made the right small decision and missed the larger one sitting underneath it, which seems worth saying plainly rather than leaving as two separate anecdotes.
The design system said one thing, the build did another
In July I computed contrast ratios for thirty small-text pairings in the design system, found one that failed, and fixed it by adding a darker step to the neutral ramp. The decision log records a passing system, and it was right about the system.
That audit ran against the designed artboards. Nothing ever re-ran it against the compiled app, and by September the two had drifted. The redesign tokens and the older scale the product launched on were both still live, and the components a person actually touches, buttons, links, the sidebar, were still on the older one. Two palettes on one screen: two navies and two teals, close enough to each other that the mismatch reads as a rendering fault rather than a decision.
Re-measuring the running build found eight pairings below the 4.5:1 minimum. Every one was the same mistake. The accent teal was doing work the token file rules out in a comment on the line that defines it: brand mark and active navigation on navy only. Teal carries white text at 2.58:1. It was backing the primary button anyway.
- Eight text pairings sat below AA in the shipped build. The worst was a button hover state at 2.95:1, and the primary button itself measured 4.16:1.
- The primary button, the destructive button, the sidebar's active row, the account avatar, and eighteen inline links all used the accent as a text or label color.
- After the migration the sign-in screen measures no failures, and its lowest pairing is 5.60:1.
- The 44px tap floor had been wired into form inputs and never into buttons, which sat near 36px. It now applies to both.
- The source carries one palette: 440 uses of the redesign tokens, and none of the old scale.
The useful part is not the fix, which took an afternoon. It is that a verified design system is not a verified product, and I had been treating the first as evidence for the second. A spec that passes tells you the colors are right. Only measuring the built output tells you the colors shipped. That check now belongs to the build.
How I'll know it's working
The business isn't open yet, so there's no usage data. The signals I'll track as it ramps now start with the inspection rather than the invoice: inspections logged per week, the share of quoted work that traces back to a documented finding, and whether a customer ever asks for a copy of the service report unprompted. That last one matters most, because it is the only signal that says the evidence was worth something to the person receiving it.
The clearest failure signal is still the simplest, whether the operator ever falls back to a spreadsheet.
First in line on the roadmap is the data model described above, because nothing else can be built until findings are rows. Behind it sit the client-facing inspection report as its own document, a reusable line-item catalog to speed quoting, and per-truck trending once there are values worth trending.

Where it stands
- Concept to a working product: brand, quoting, invoicing, service logging, and job history in one place instead of four.
- Built and handed to the owner, who intends to run the business on it. The build-time deployment has since been taken down, so there is no live instance today. He hasn't started yet, so there are no users and no usage data. The business hasn't launched or named itself, so FleetServ is the working name.
- Inspection capture ships as a pass or a fail across six categories, with the technician's photos reaching the customer in a service report PDF. The structured inspection module is specced, not built, and the section above says why.
- Specced and built 0-to-1 with Claude and Claude Code, including a custom design system (tokens, components, brand mark) built alongside the product, not retrofitted.
- A React single-page app on Supabase for data, auth, and photo storage, with PDFs via react-pdf. It ran on Vercel during the build; that deployment is no longer up.
Screens
These are the commercial layer, which is the part that shipped. The inspection surface is a checklist inside the visit form, and is not worth a screenshot until it is the thing described above.
The inspection module, as designed
These three are drawn on the app's own tokens and chrome, and they are not screenshots: nothing behind them runs. They are here because the roadmap above is easier to argue with a picture than a paragraph, and each one maps to a piece of the data model that has to exist first. Every frame carries a mono banner saying so, in the frame rather than only in the caption, so the label survives if the image travels without this page.